Deposition
Deposition measurements are a central part of Level II monitoring in Germany. They help quantify the impact of air pollutants on forest ecosystems, such as sulfur or nitrogen compounds. The measurements at the Level II sites allow the identification of trends, provide insights into the spatial and temporal variability of deposition amounts, and serve as reference points for country-wide modeling approaches, such as those provided by the Federal Environment Agency. Along with data from other surveys, deposition measurements contribute to numerous other research questions. For instance, in combination with soil solution data and vegetation surveys, they are a basis for the calculation and validation of critical loads for eutrophying and acidifying substances. Finally, the combined analysis of deposition measurements, meteorological records, soil studies, and other surveys allows conclusions about the relative importance of these factors for the vitality and growth of trees.
Assessed parameters:
- Bulk precipitation
- Substance concentrations
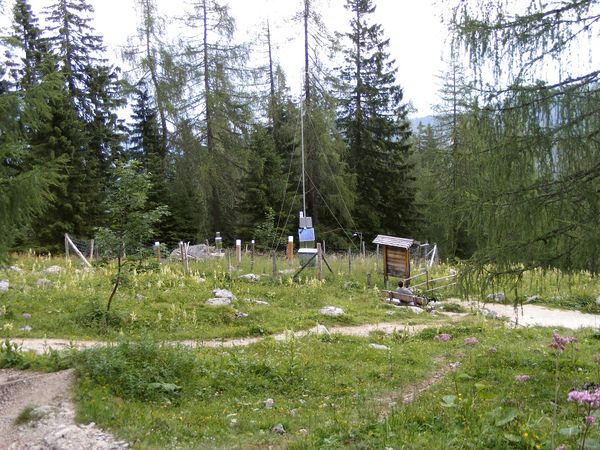
Open fields
In addition to the study sites within the forest stands, the Level II monitoring network also includes open fields in clearings or at the forest edge. By comparing the measurements in the open fields with those within the stands, the importance of the canopy space (e.g., the so-called 'filtering effect') for deposition in forests can be determined.
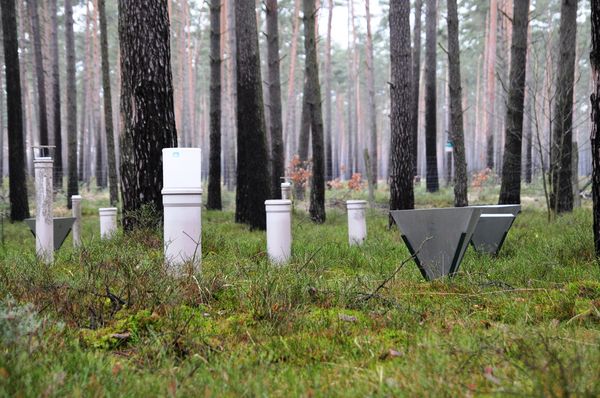
Throughfall
The deposition collectors on the Level II sites capture throughfall precipitation. Exchange processes in the canopy lead to a decrease in the concentrations of substances that are taken up by the tree and a simultaneous accumulation of substances washed out of the leaves and needles.
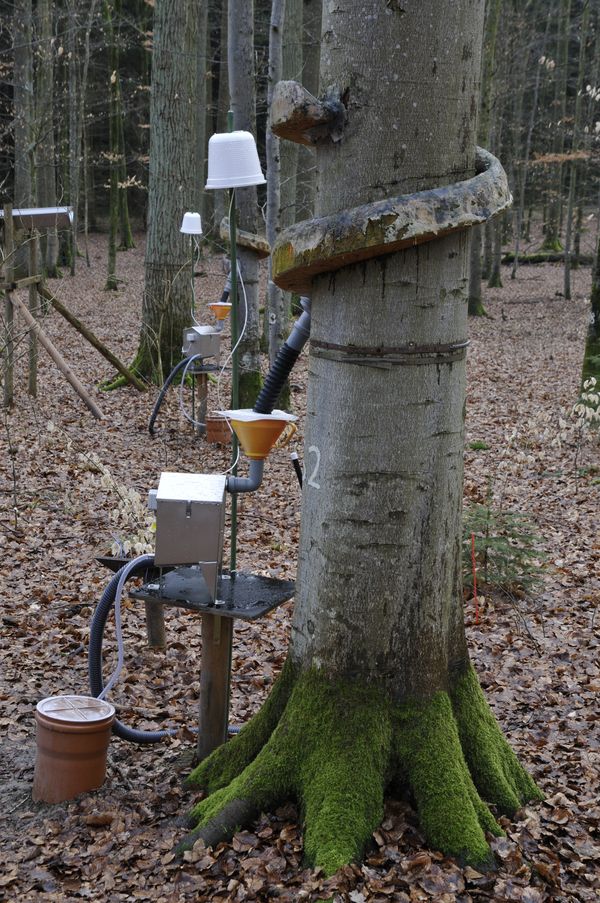
Stem flow
In smooth-barked tree species such as beech (Fagus sylvatica L.), stemflow accounts for a significant proportion of the precipitation in the stand. Therefore, in these tree species, the collectors distributed evenly within the stand are supplemented by collectors placed directly at the trunk.


